Free Access
Fig. 13
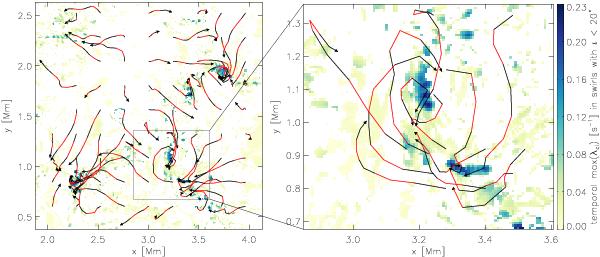
Horizontal pathlines in a 177 s time interval, plotted on top of a map of the temporal maximum of the swirling strength in vertically oriented swirls, at the average height of the optical surface. Each segment (black or red) of a pathline corresponds to 35 s.
Current usage metrics show cumulative count of Article Views (full-text article views including HTML views, PDF and ePub downloads, according to the available data) and Abstracts Views on Vision4Press platform.
Data correspond to usage on the plateform after 2015. The current usage metrics is available 48-96 hours after online publication and is updated daily on week days.
Initial download of the metrics may take a while.