Free Access
Fig. 12
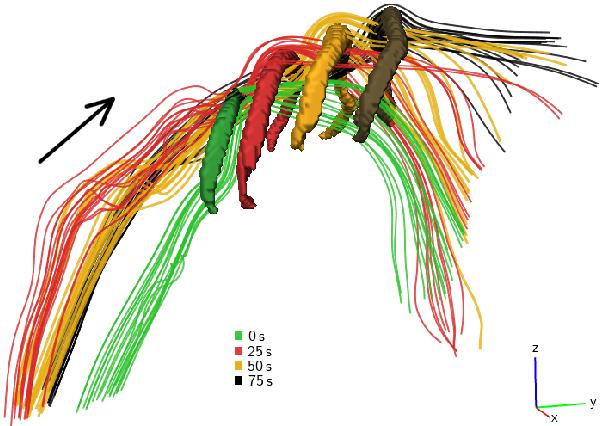
Evolution of the small vortex arc which is shown in a blow-up in Fig. 11. The isosurfaces show the arc at four different times with a separation of 25 s. For each stage, selected velocity streamlines are plotted in the corresponding color.
Current usage metrics show cumulative count of Article Views (full-text article views including HTML views, PDF and ePub downloads, according to the available data) and Abstracts Views on Vision4Press platform.
Data correspond to usage on the plateform after 2015. The current usage metrics is available 48-96 hours after online publication and is updated daily on week days.
Initial download of the metrics may take a while.