Fig. 1
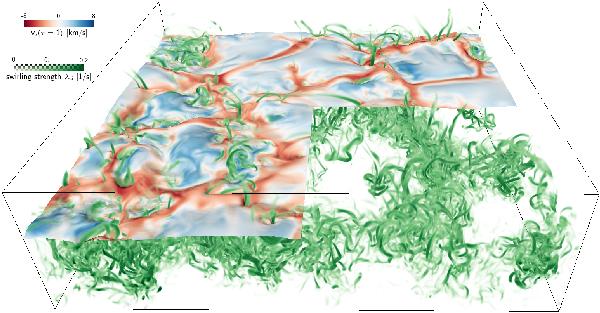
Snapshot of the swirling strength (green volume rendering) and the optical surface color-coded with vertical velocity (downflows in red and upflows in blue) in Run C. The size of the box shown is 4.8 × 4.8 × 1.4 Mm3. The optical surface is hidden in the lower right quadrant, uncovering the swirling structure in the subsurface layers. An animated plot that shows the temporal evolution of the swirling strength without the optical surface is available in the electronic edition of the journal.
Current usage metrics show cumulative count of Article Views (full-text article views including HTML views, PDF and ePub downloads, according to the available data) and Abstracts Views on Vision4Press platform.
Data correspond to usage on the plateform after 2015. The current usage metrics is available 48-96 hours after online publication and is updated daily on week days.
Initial download of the metrics may take a while.