Fig. 3
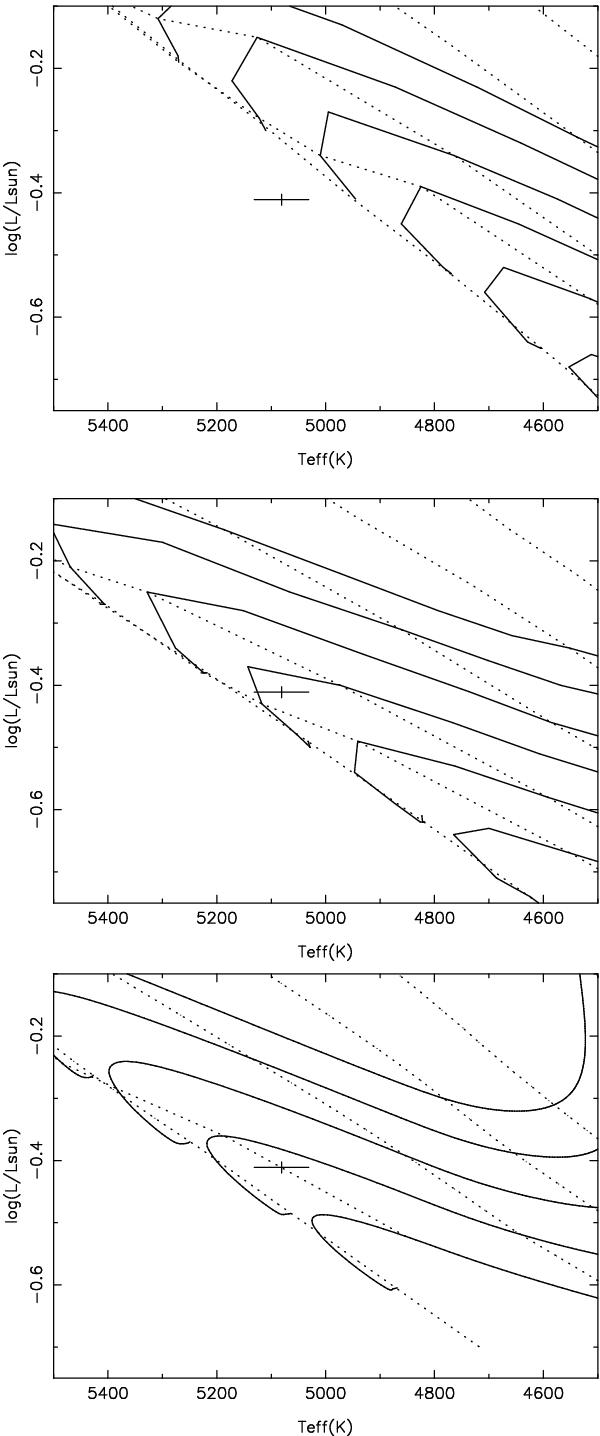
H-R diagrams for several PMS evolutionary models. Isochrones (dotted lines) correspond to 10 (top isochrone), 16, 25, 40, and 100 Myr (an additional 50 Myr isochrone is shown in the middle plot). Isomasses (continuous lines) are for 0.75 (bottom isomass), 0.80, 0.85, 0.90, 0.95, and 1.0 M⊙. Points with error bars correspond to measurements (see Table 2). (Top) BCAH98 models, α = 1. (Middle) BCAH98 models, α = 1.9 (solar value). (Bottom) MDKH04 models.
Current usage metrics show cumulative count of Article Views (full-text article views including HTML views, PDF and ePub downloads, according to the available data) and Abstracts Views on Vision4Press platform.
Data correspond to usage on the plateform after 2015. The current usage metrics is available 48-96 hours after online publication and is updated daily on week days.
Initial download of the metrics may take a while.