Fig. 5
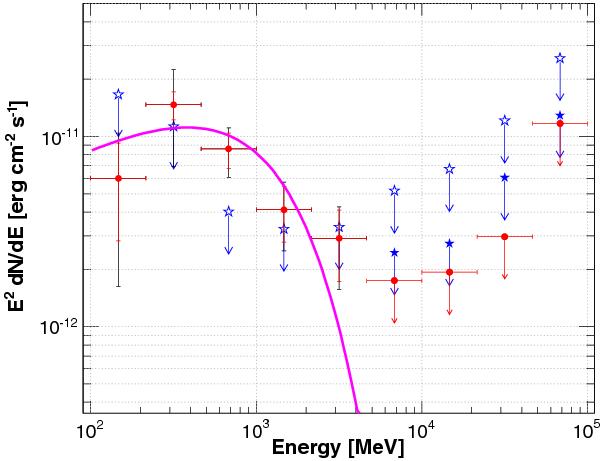
Spectral energy distribution of PSR J1357−6449 in gamma rays. The LAT spectral points (in red dots) are obtained using the maximum-likelihood method gtlike described in Sect. 5.3 in 9 logarithmically-spaced energy bins between 100 MeV and 100 GeV. The statistical errors are shown in red, while the black lines take into account both the statistical and systematic errors as discussed in Sect. 5.3. The magenta solid line presents the result obtained by fitting an exponentially cut-off power law to the data in the 100 MeV−100 GeV energy range using a maximum-likelihood fit. A 95% C.L. upper limit is computed when the statistical significance is lower than 3σ (red dots). Blue filled (open) stars represent the 95% C.L. upper limits derived assuming a Gaussian of 0.2° at the position of HESS J1356-645 in the whole signal (in the off-pulse).
Current usage metrics show cumulative count of Article Views (full-text article views including HTML views, PDF and ePub downloads, according to the available data) and Abstracts Views on Vision4Press platform.
Data correspond to usage on the plateform after 2015. The current usage metrics is available 48-96 hours after online publication and is updated daily on week days.
Initial download of the metrics may take a while.