Fig. 4
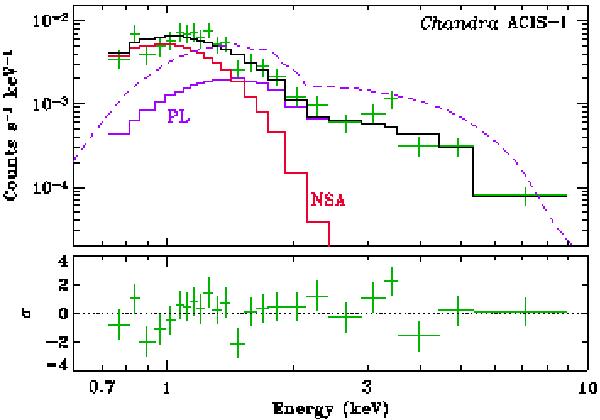
Spectrum of PSR J1357−6429 detected with the Chandra ACIS-I instrument (crosses in the upper panel) and fitted with a NSA-plus-PL model (solid curves). The thermal (NSA) component, as well as the hydrogen column density, is the same as in Fig. 2. The dashed curve indicates the PL component derived from the EPIC spectra. The lower panel shows residuals in the spectral fit.
Current usage metrics show cumulative count of Article Views (full-text article views including HTML views, PDF and ePub downloads, according to the available data) and Abstracts Views on Vision4Press platform.
Data correspond to usage on the plateform after 2015. The current usage metrics is available 48-96 hours after online publication and is updated daily on week days.
Initial download of the metrics may take a while.