Fig. 1
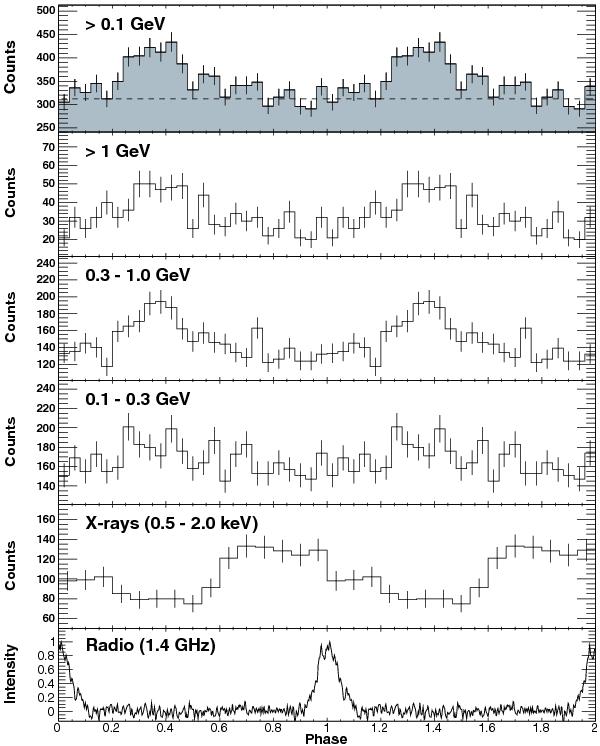
Top panel: phase-aligned histogram of PSR J1357−6429 above 0.1 GeV and within an energy-dependent circular region as defined in Sect. 5.1. Two rotations are plotted with 25 bins per period. The dashed line shows the background level estimated using two nearby circular regions as described in Sect. 5.1. Three following panels: phase histograms for PSR J1357−6429 in the three indicated energy ranges, each with 25 bins per pulse period. Second panel from bottom: X-ray pulse profile extracted from the XMM-Newton data of 2009 in the 0.5–2 keV energy band. Two rotations are plotted with 15 bins per period. Bottom panel: radio pulse profile based on Parkes observations at a center frequency of 1.4 GHz with 256 phase bins (Weltevrede et al. 2010b).
Current usage metrics show cumulative count of Article Views (full-text article views including HTML views, PDF and ePub downloads, according to the available data) and Abstracts Views on Vision4Press platform.
Data correspond to usage on the plateform after 2015. The current usage metrics is available 48-96 hours after online publication and is updated daily on week days.
Initial download of the metrics may take a while.