Fig. 7
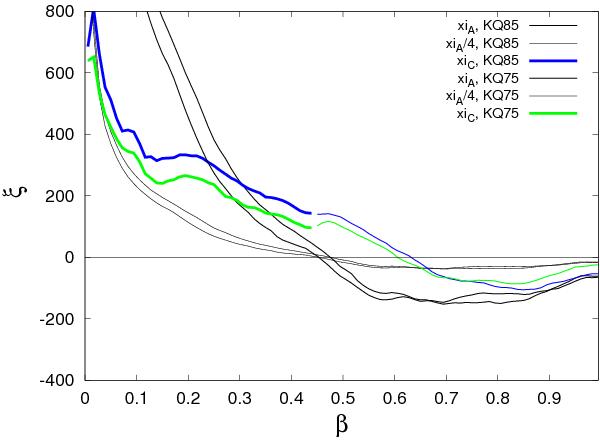
Spatial auto- and cross-correlation functions, ξA and ξC, respectively, for the WMAP7 ILC map for matched-circle radius α = 23°, shown as thin and thick (colour online) curves, respectively. The cross-correlation function is uniformly sampled only for β ≤ 0.44 (for calculation speed); at higher separations, it is, in principle, biased. In order to better compare the small-scale behaviour of ξA and ξC, the auto-correlation reduced (arbitrarily) by a factor of 4 is also shown. The mostly upper (lower) member of each close pair of functions is for the KQ85 (KQ75) galactic mask.
Current usage metrics show cumulative count of Article Views (full-text article views including HTML views, PDF and ePub downloads, according to the available data) and Abstracts Views on Vision4Press platform.
Data correspond to usage on the plateform after 2015. The current usage metrics is available 48-96 hours after online publication and is updated daily on week days.
Initial download of the metrics may take a while.