Fig. 4
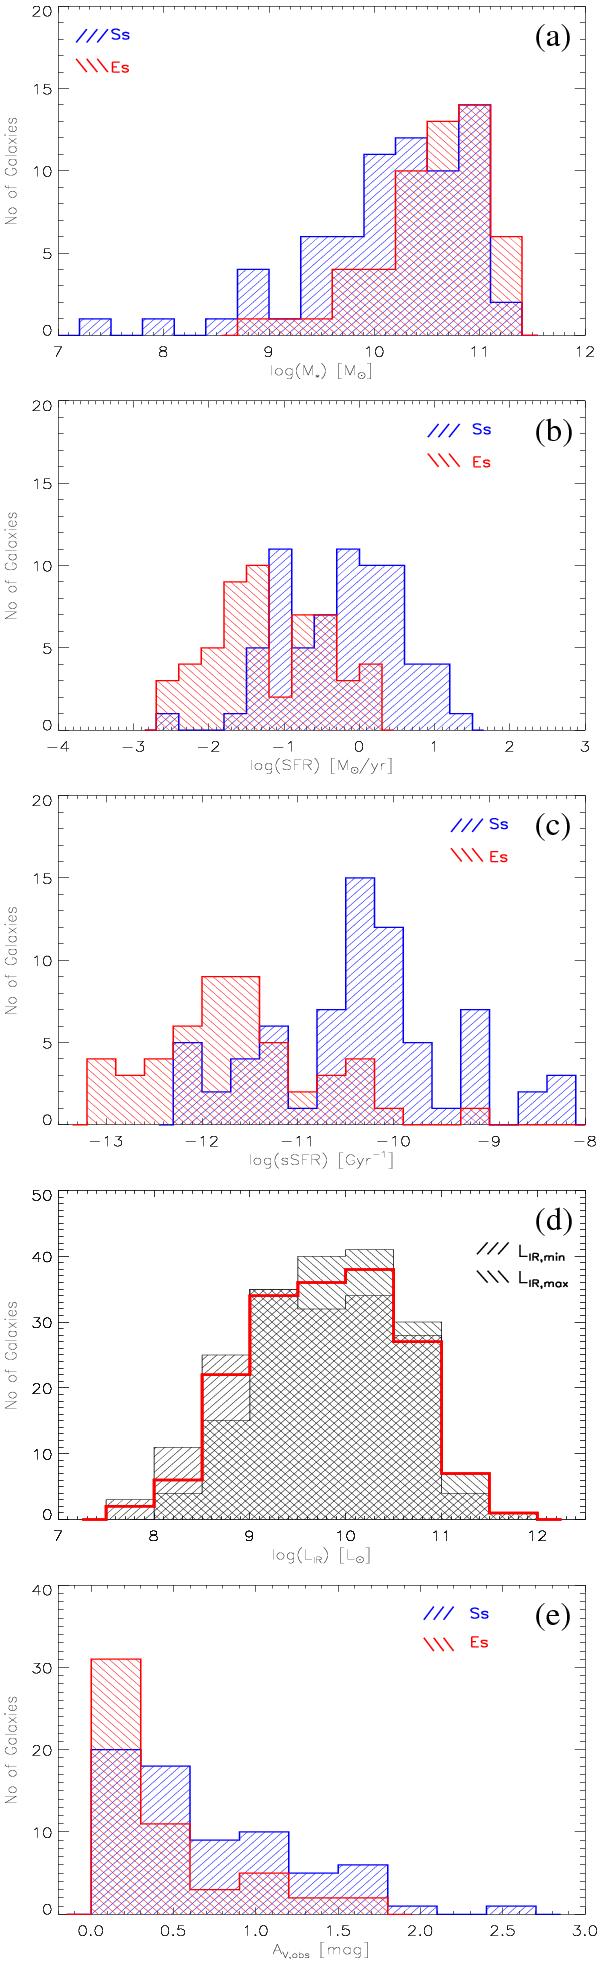
Histograms of several properties of our HCG sample. Early type galaxies are marked in red and late type galaxies in blue: a) the distributions of the stellar masses (M ∗ ), b) the distributions of the star formation rates (SFR), c) the distributions of specific SFR (sSFR), and d) the histogram of the IR luminosities, LIR, in red, as estimated by our SED modeling. Because of the absence of far-IR observations for most of the sample, we overplot in hashed areas the histograms corresponding to the minimum and maximum LIR of each galaxy, associated to the 16th and 84th percentile ranges of the best fit, respectively, e) a histogram of the extinction inferred from the SED fit (AV, obs) as measured model-derived atttenuated and unattenuated SED (see Sect. 3.1.3).
Current usage metrics show cumulative count of Article Views (full-text article views including HTML views, PDF and ePub downloads, according to the available data) and Abstracts Views on Vision4Press platform.
Data correspond to usage on the plateform after 2015. The current usage metrics is available 48-96 hours after online publication and is updated daily on week days.
Initial download of the metrics may take a while.