Fig. 2
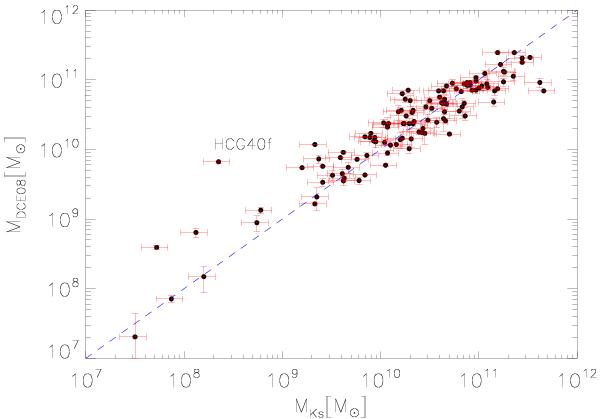
Stellar masses based on the da Cunha et al. (2008) model (hereafter MDCE08) are plotted as a function of the ones derived from Bell et al. (2003) relation based on Ks luminosity (MKs) after applying the corrections discussed in the text. Vertical error bars indicate the 16–84 percentile ranges in the recovered probability distributions, while the horizontal error bars are the 30% errors as described by Bell et al. (2003) determined from the scatter in the models. The blue dashed line represents the one-to-one relation.
Current usage metrics show cumulative count of Article Views (full-text article views including HTML views, PDF and ePub downloads, according to the available data) and Abstracts Views on Vision4Press platform.
Data correspond to usage on the plateform after 2015. The current usage metrics is available 48-96 hours after online publication and is updated daily on week days.
Initial download of the metrics may take a while.