Fig. 12
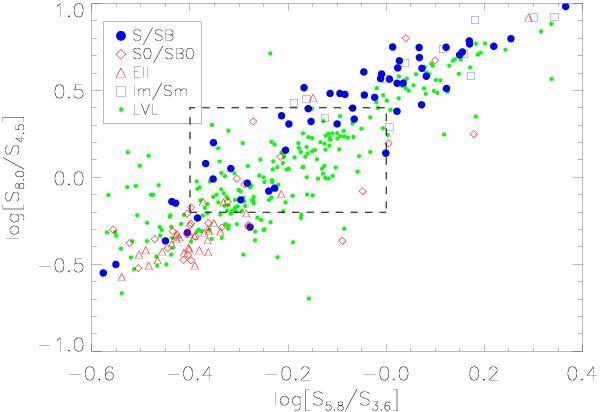
The IRAC color–colors plot, originally presented in Fig. 7. Blue circles indicate the spiral galaxies of our HCG sample, blue squares are the irregulars, red triangles are the elliptical galaxies, and red diamonds the lenticular ones. Green dots indicate the LVL galaxies. According to Johnson et al. (2007) the “gap” is located in the area enclosed by the dashed lines.
Current usage metrics show cumulative count of Article Views (full-text article views including HTML views, PDF and ePub downloads, according to the available data) and Abstracts Views on Vision4Press platform.
Data correspond to usage on the plateform after 2015. The current usage metrics is available 48-96 hours after online publication and is updated daily on week days.
Initial download of the metrics may take a while.