Fig. 10
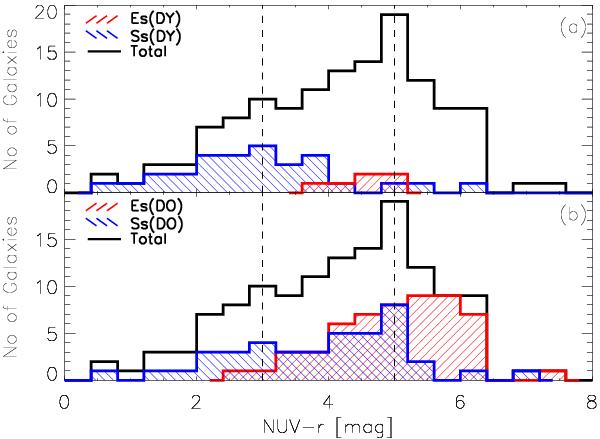
a) NUV-r histogram of our HCG galaxy sample shown as a black solid line. The corresponding histograms of the early- and late-type galaxies found in dynamically “young” groups are shown with the red and blue shaded areas, respectively. b) Same as in a), but for the galaxies in dynamically “old” groups. The region of 3 < NUV-r < 5, identified as “green valley”, is marked with the vertical dashed lines.
Current usage metrics show cumulative count of Article Views (full-text article views including HTML views, PDF and ePub downloads, according to the available data) and Abstracts Views on Vision4Press platform.
Data correspond to usage on the plateform after 2015. The current usage metrics is available 48-96 hours after online publication and is updated daily on week days.
Initial download of the metrics may take a while.