Fig. 3
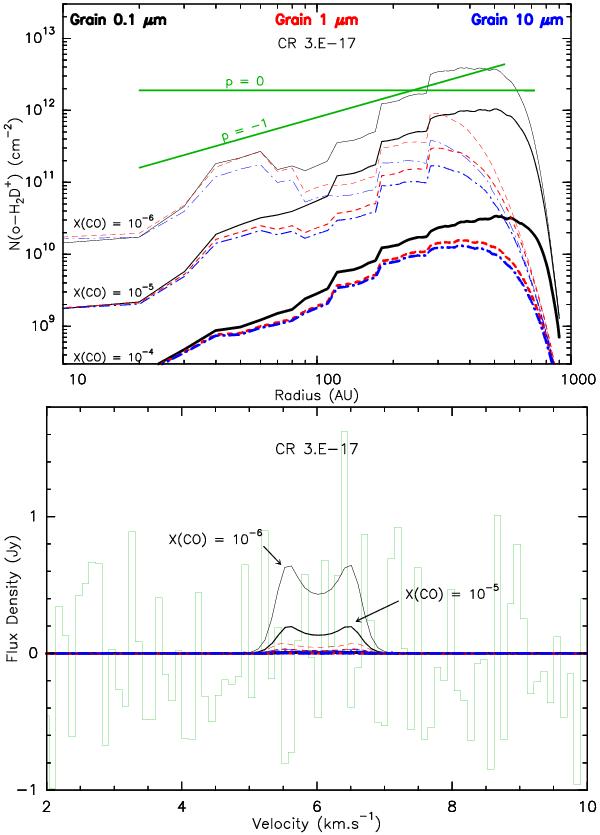
Results from the chemical modeling for DM Tau, case L, Model 2 and ξ = 3 × 10-17s-1. Top: predicted o-H2D+ column densities as a function of radius for several values of grain size: a = 0.1 μm (black); 1 (red) and 10 (blue); and CO abundance: x[CO] = 10-6 (thin lines) 10-5 (medium) and 10-4 (thick). The green lines correspond to the best 3σ upper limits derived from observations with p = 0 and p = −1. Bottom: observed spectrum (green) and predicted line profiles (same color and thickness convention).
Current usage metrics show cumulative count of Article Views (full-text article views including HTML views, PDF and ePub downloads, according to the available data) and Abstracts Views on Vision4Press platform.
Data correspond to usage on the plateform after 2015. The current usage metrics is available 48-96 hours after online publication and is updated daily on week days.
Initial download of the metrics may take a while.