Fig. 8
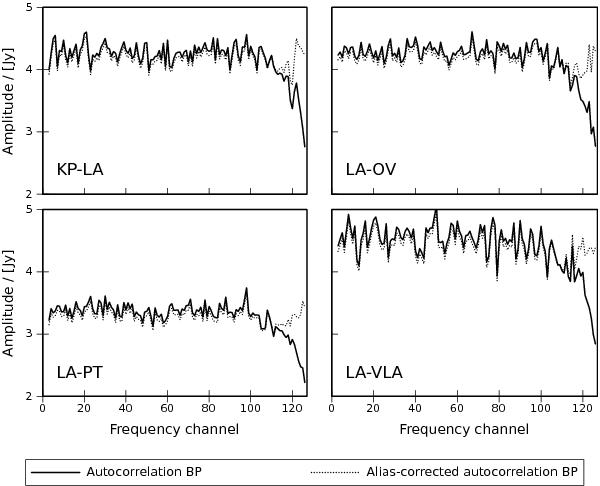
Continuum calibrator cross-power spectral amplitudes on representative baselines to the reference antenna LA, calibrated in amplitude, group delay, and fringe rate, and averaged over the duration of the observing run; calibrated additionally either with the original autocorrelation bandpass response (solid line) or the alias-corrected bandpass response (dotted line).
Current usage metrics show cumulative count of Article Views (full-text article views including HTML views, PDF and ePub downloads, according to the available data) and Abstracts Views on Vision4Press platform.
Data correspond to usage on the plateform after 2015. The current usage metrics is available 48-96 hours after online publication and is updated daily on week days.
Initial download of the metrics may take a while.