Fig. 5
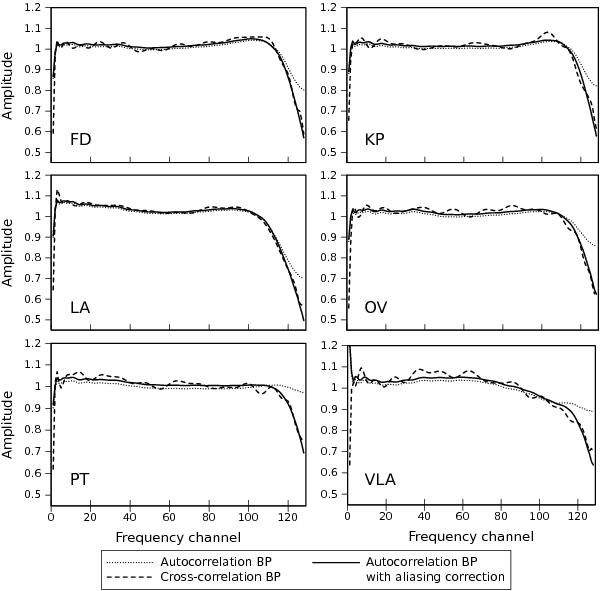
Bandpass amplitude response function solutions in RCP for a subset of representative antennas obtained from: i) autocorrelation calibrator data (dotted line) by solving Eq. (19); ii) cross-correlation calibrator data (dashed line) by solving Eq. (25); and iii) the autocorrelation bandpass solutions corrected for a fitted aliasing model (solid line), as defined by Eq. (26).
Current usage metrics show cumulative count of Article Views (full-text article views including HTML views, PDF and ePub downloads, according to the available data) and Abstracts Views on Vision4Press platform.
Data correspond to usage on the plateform after 2015. The current usage metrics is available 48-96 hours after online publication and is updated daily on week days.
Initial download of the metrics may take a while.