Free Access
Fig. 10
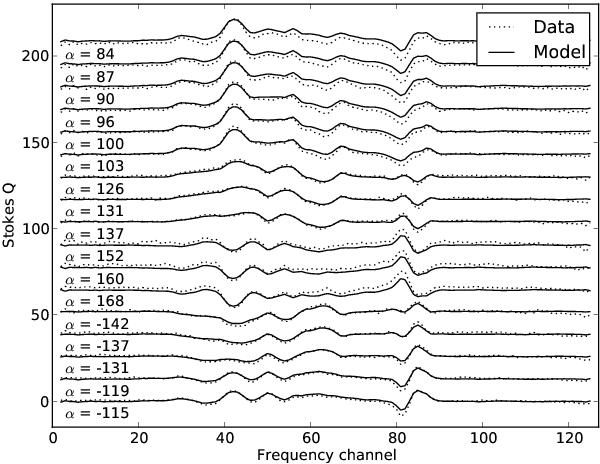
Scan pre-averaged autocorrelation Stokes Q spectra before polarization self-calibration (dotted line) and as fitted against Eq. (8) including polarization terms (solid line). Each scan pre-average is labeled at left by parallactic angle α (in deg).
Current usage metrics show cumulative count of Article Views (full-text article views including HTML views, PDF and ePub downloads, according to the available data) and Abstracts Views on Vision4Press platform.
Data correspond to usage on the plateform after 2015. The current usage metrics is available 48-96 hours after online publication and is updated daily on week days.
Initial download of the metrics may take a while.