Fig. 2
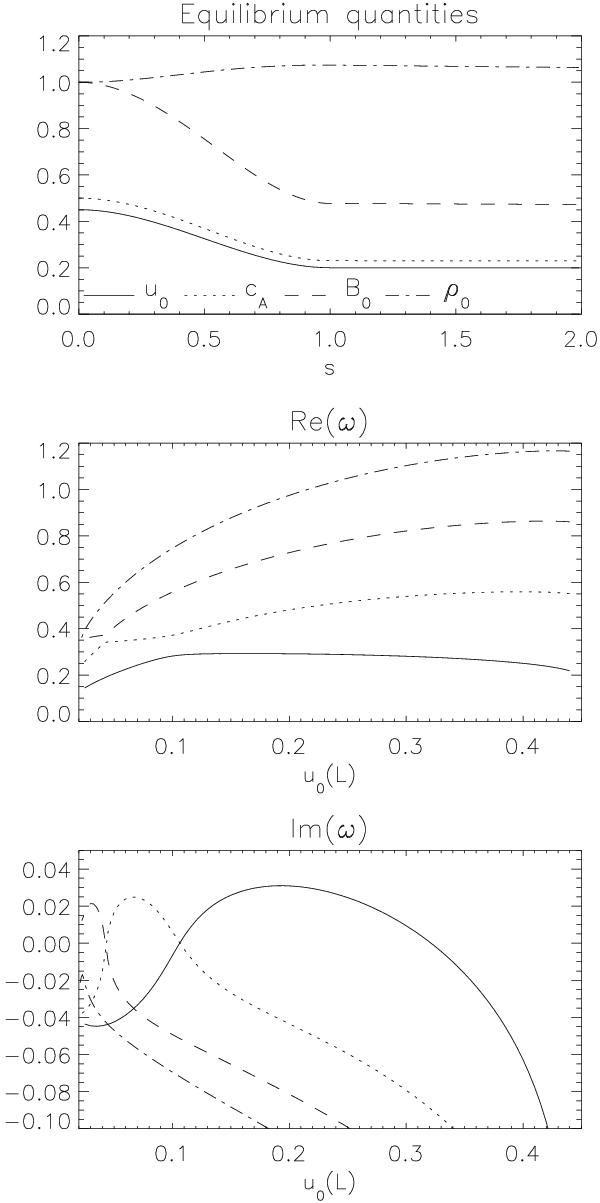
Profiles of the equilibrium quantities with cA(0) = 0.5, u0(0) = 0.45 and u0(L) = 0.2 for a horizontal flux tube are shown with different linestyles in the upper panel. All quantities are constant when s > L. Speed and distance are normalised with respect to the constant sound speed cs and the length of the nonuniform layer L, respectively (see text for an extended discussion). The middle and lower panels show the corresponding real and imaginary parts of the eigenmode frequencies plotted against u0(L). The solid, dotted, dashed and dot-dashed lines represent the first, second, third and fourth modes.
Current usage metrics show cumulative count of Article Views (full-text article views including HTML views, PDF and ePub downloads, according to the available data) and Abstracts Views on Vision4Press platform.
Data correspond to usage on the plateform after 2015. The current usage metrics is available 48-96 hours after online publication and is updated daily on week days.
Initial download of the metrics may take a while.