Fig. 1
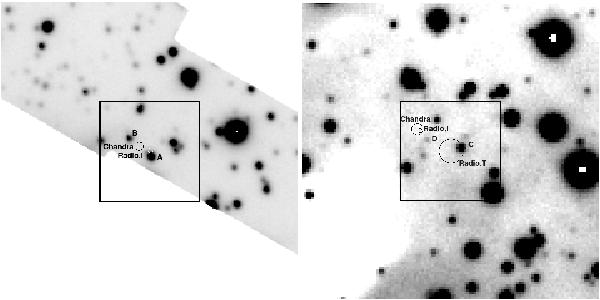
VLT/FORS2 observations of PSR J1357−6429 (left) and PSR
J1048−5832 (right) taken in the vHIGH
filter, with integration times of 14 700 and 24 000 s, respectively. North is at the
top, east to the left. Image cutouts are 30″ × 30″ in size. The circles marks the
pulsar radio (T = timing; I = interferometric) and Chandra
positions derived according to our astrometry re-calibration (Sect. 2.2). Their
radius account for the absolute error on the reference X-ray/radio coordinates
(Table 2) and the accuracy of our optical
astrometry (0 2).
The radii of the error circles are ~043
and ~025
for the Chandra and radio-interferometry coordinates of PSR
J1357−6429, respectively, and ~058,
~022,
and ~122,
for the Chandra, radio-interferometry, and radio-timing coordinates
of PSR J1048−5832, respectively. The white areas in the left panel correspond to
the edges of the occulting bars used in the FORS2 frame to mask bright stars close
to the pulsar position. The clumpy white structure in the right panel is part of an
extended nebulosity detected in the PSR J1048−5832 field (see Sect. 3.2). In both
panels, the square (10″ × 10″) corresponds to the area shown in Fig. 3.
2).
The radii of the error circles are ~043
and ~025
for the Chandra and radio-interferometry coordinates of PSR
J1357−6429, respectively, and ~058,
~022,
and ~122,
for the Chandra, radio-interferometry, and radio-timing coordinates
of PSR J1048−5832, respectively. The white areas in the left panel correspond to
the edges of the occulting bars used in the FORS2 frame to mask bright stars close
to the pulsar position. The clumpy white structure in the right panel is part of an
extended nebulosity detected in the PSR J1048−5832 field (see Sect. 3.2). In both
panels, the square (10″ × 10″) corresponds to the area shown in Fig. 3.
Current usage metrics show cumulative count of Article Views (full-text article views including HTML views, PDF and ePub downloads, according to the available data) and Abstracts Views on Vision4Press platform.
Data correspond to usage on the plateform after 2015. The current usage metrics is available 48-96 hours after online publication and is updated daily on week days.
Initial download of the metrics may take a while.