Fig. 9
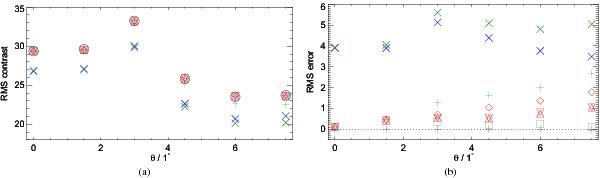
RMS contrasts a) and RMS errors b) from synthetic image deconvolution experiment, both in percent of the mean intensity. Black circles (○, in a only): Synthetic “true” images. Blue symbols: monochromatic images convolved with S0 and then summed. The crosses (× ) correspond to those images and the pluses (+ ) to the same images after deconvolution with S0. Green symbols: monochromatic images convolved with Smono(λ,θ). The crosses (× ) correspond to those images and the pluses (+ ) to the same images after deconvolution with S0. The squares (□) correspond to those summed images again, but now deconvolved with S0·Stilt(θ). Red symbols: convolved images like for the green symbols but with three types of imperfections in the deconvolution. Up triangles (△ ): transmission phase not used for calculating Stilt. Down triangles (▽ ): deconvolve with the MTF, S0·|Stilt(θ)|. Diamonds (◇): deconvolution with S0·Stilt(θ) mirrored in the x direction.
Current usage metrics show cumulative count of Article Views (full-text article views including HTML views, PDF and ePub downloads, according to the available data) and Abstracts Views on Vision4Press platform.
Data correspond to usage on the plateform after 2015. The current usage metrics is available 48-96 hours after online publication and is updated daily on week days.
Initial download of the metrics may take a while.