Fig. 9
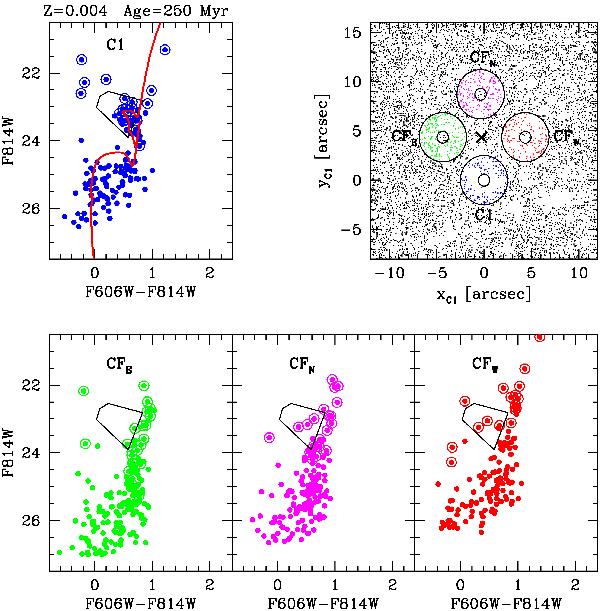
Comparison of the CMDs of the circular annuli around Cluster 1 and three nearby control fields indicated in the upper right panel. In this map the × sign indicates the center of the galaxy. The plotted points correspond to sources having crowd <1.0. In the CMDs, sources with crowd <0.3 are marked by an empty circle concentric to the filled one. An isochrone providing a reasonable fit to the observed CMD is also over-plotted to the C1 CMD (thick red line). A selection box for the BL population is superimposed to each CMD.
Current usage metrics show cumulative count of Article Views (full-text article views including HTML views, PDF and ePub downloads, according to the available data) and Abstracts Views on Vision4Press platform.
Data correspond to usage on the plateform after 2015. The current usage metrics is available 48-96 hours after online publication and is updated daily on week days.
Initial download of the metrics may take a while.