Fig. 7
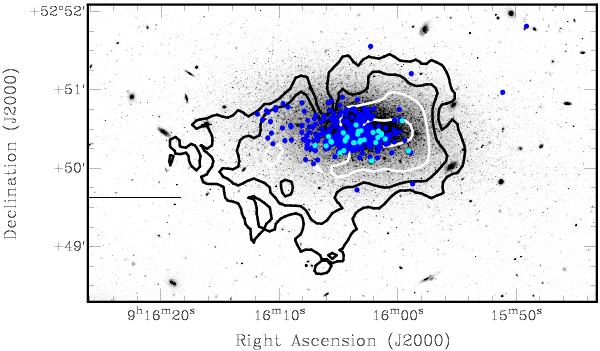
Contours of the total HI image drawn on top of an optical g band image obtained with the LBT, both from Paper I. Contour levels are 5, 10 (black contours), 20 and 50 (white contours) × 1019 cm-2. Blue circles denote the stars with −0.4 < V − I < 0.0 and 23 < I < 25.5 while the cyan circles show the positions of the stars in the same color interval but with I < 23, as if Fig. 1).
Current usage metrics show cumulative count of Article Views (full-text article views including HTML views, PDF and ePub downloads, according to the available data) and Abstracts Views on Vision4Press platform.
Data correspond to usage on the plateform after 2015. The current usage metrics is available 48-96 hours after online publication and is updated daily on week days.
Initial download of the metrics may take a while.