Fig. 4
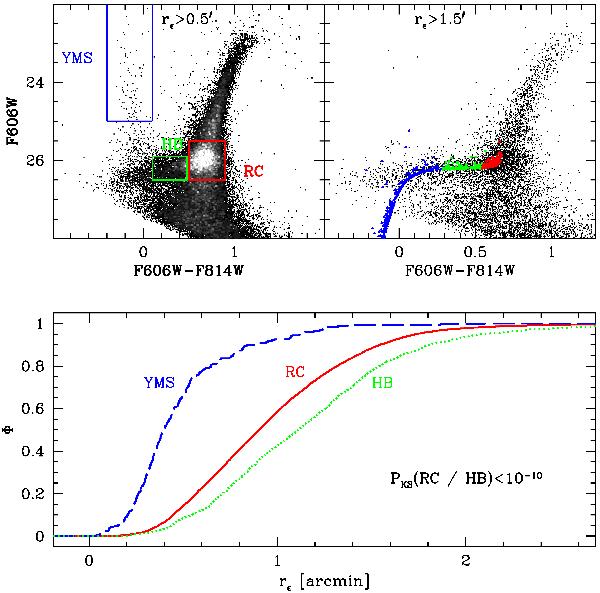
Upper left panel: the adopted selection boxes are plotted on the CMD for rϵ > 0.5′ (the innermost region has been excluded to avoid confusion in the panel). Upper right panel: a synthetic HB population computed from BASTI models, reported to the same distance and reddening of VV124, is superposed to the observed CMD for rϵ > 1.5′. The radial selection is adopted to obtain the cleanest view of the HB. Red HB, RR Lyrae variables, and blue HB are plotted in red, green, and blue, respectively. Lower panel: radial distribution of the various populations selected with the CMD boxes, as indicated by the labels.
Current usage metrics show cumulative count of Article Views (full-text article views including HTML views, PDF and ePub downloads, according to the available data) and Abstracts Views on Vision4Press platform.
Data correspond to usage on the plateform after 2015. The current usage metrics is available 48-96 hours after online publication and is updated daily on week days.
Initial download of the metrics may take a while.