Fig. 3
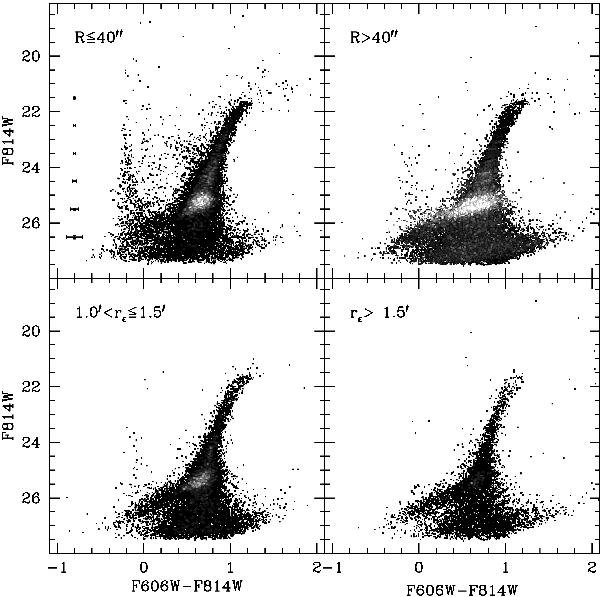
Upper panels: CMD of VV124 from the ACS data within (left panel) and outside (right panel) a circle of radius Rp = 40″. The average photometric errors are reported as error bars in the left panel. Lower panels: CMDs in other regions of the ACS field delimited by the ellipses plotted in Fig. 1. The right panel regards a radial region similar to that considered in Paper I to tentatively detect the extended HB population (see their Fig. 9). In all the panels stars are plotted as black points in regions of the CMD with a few stars and as gray squares otherwise, with the scale of gray proportional to the local density of stars in the CMD (lighter tones of gray correspond to higher density).
Current usage metrics show cumulative count of Article Views (full-text article views including HTML views, PDF and ePub downloads, according to the available data) and Abstracts Views on Vision4Press platform.
Data correspond to usage on the plateform after 2015. The current usage metrics is available 48-96 hours after online publication and is updated daily on week days.
Initial download of the metrics may take a while.