Fig. 1
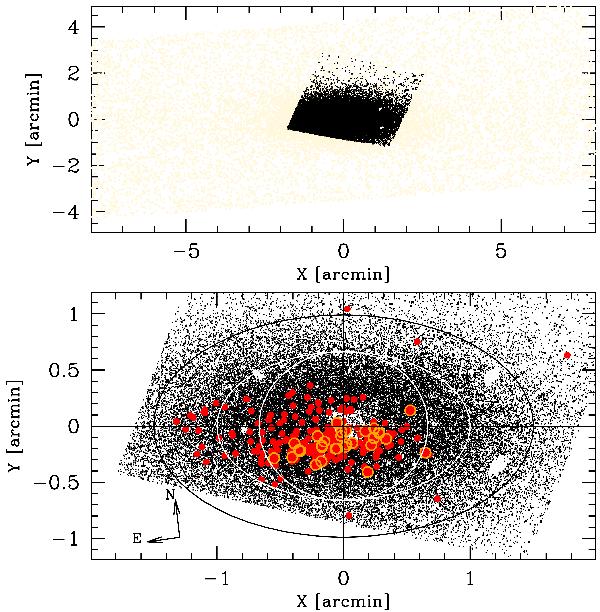
Upper panel: stars detected in the ACS images (dark dots) are superposed to the stars from the LBT sample of Paper I (gray dots) in a projected coordinate system centered on the center of VV124 and rotated to have the X axis coincide with the major axis of the galaxy (see Paper I). Only stars brighter than I = 26.5 from the ACS sample have been plotted, for clarity. Lower panel: zoomed view of the central part of the ACS sample in the same coordinate system. Two concentric ellipses of semi-major axis a = 1.0′ and a = 1.5′, with the same orientation and ellipticity of the galaxy isophotes (see Paper I) are overplotted (in white and in black, respectively). The white circle has a radius Rp = 40″, enclosing the region studied by J11. Blue stars lying on the young main sequence (YMS; −0.4 ≤ V − I ≤ 0.0 and I < 25.5, see Fig. 3) are plotted as red filled circles, the brightest ones (having I ≤ 23.0) are encircled in orange.
Current usage metrics show cumulative count of Article Views (full-text article views including HTML views, PDF and ePub downloads, according to the available data) and Abstracts Views on Vision4Press platform.
Data correspond to usage on the plateform after 2015. The current usage metrics is available 48-96 hours after online publication and is updated daily on week days.
Initial download of the metrics may take a while.