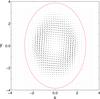
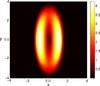
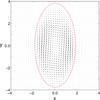
Fig. 10
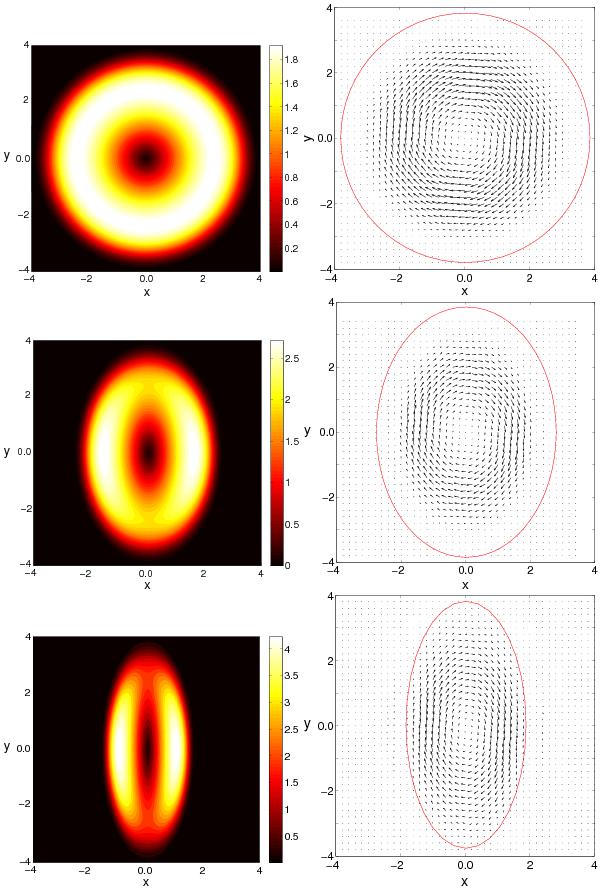
Current density (left) and plasma flow vectors (right) in the kinematic torsional fan model. Plotted for B0 = L0 = j = b = 1, a = 4 and p = q = 1 (above), p = q = 2 (middle) p = q = 5 (below). The grey curve (red online) in the right-hand plots marks the boundary of the non-ideal region. The current density is plotted at z = 0, while the plasma flow is plotted in the plane z = 0.5.
Current usage metrics show cumulative count of Article Views (full-text article views including HTML views, PDF and ePub downloads, according to the available data) and Abstracts Views on Vision4Press platform.
Data correspond to usage on the plateform after 2015. The current usage metrics is available 48-96 hours after online publication and is updated daily on week days.
Initial download of the metrics may take a while.