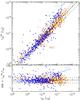
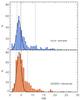
Fig. 9

Left:  [IRAS]
versus L8 for local ISO and AKARI galaxies (filled blue
dots). The GOODS-Herschel galaxies are shown in the background with
lighter orange symbols (same points as in Fig. 6) together with their median (black solid line) and 68% dispersion (black
dashed lines). The light blue line shows the locus traced by the CE01 SED library.
Right: histogram of the IR8 ratios for the local galaxy sample
(blue, upper panel) and GOODS-Herschel sample
(orange, bottom panel). The solid curves show Gaussians fit to the
distributions. The vertical grey lines indicate the median (solid) and 68%
dispersion (dashed) for the full samples (as in Eqs. (3), (2)).
[IRAS]
versus L8 for local ISO and AKARI galaxies (filled blue
dots). The GOODS-Herschel galaxies are shown in the background with
lighter orange symbols (same points as in Fig. 6) together with their median (black solid line) and 68% dispersion (black
dashed lines). The light blue line shows the locus traced by the CE01 SED library.
Right: histogram of the IR8 ratios for the local galaxy sample
(blue, upper panel) and GOODS-Herschel sample
(orange, bottom panel). The solid curves show Gaussians fit to the
distributions. The vertical grey lines indicate the median (solid) and 68%
dispersion (dashed) for the full samples (as in Eqs. (3), (2)).
Current usage metrics show cumulative count of Article Views (full-text article views including HTML views, PDF and ePub downloads, according to the available data) and Abstracts Views on Vision4Press platform.
Data correspond to usage on the plateform after 2015. The current usage metrics is available 48-96 hours after online publication and is updated daily on week days.
Initial download of the metrics may take a while.