Fig. 6

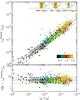
Left: comparison of  (8–1000 μm) as directly measured from Herschel
(
(8–1000 μm) as directly measured from Herschel
( )
with the value extrapolated from 24 μm
(
)
with the value extrapolated from 24 μm
( )
using the CE01 technique. Only “clean” galaxies are represented (as defined in
Sect. 3.1). Galaxies with spectroscopic and
photometric redshifts (from both GOODS–north and south) are marked with filled and
open symbols respectively. Colors range from black (z ~ 0)
to orange (z ~ 2.5), passing through green
(z ~ 1) and red (z ~ 2). The
wavelength range sampled by the MIPS-24 μm passband is shown in
orange at the top of the figure where it is compared to the redshifted SED of M 82.
The dashed line in the left-hand side panels is the one-to-one correlation. The
sliding median and 16th and 84th percentiles of the distribution are shown with white
dots connected with a solid line and grey zone respectively. The bottom panel
shows the ratio of the actual over extrapolated total IR luminosity.
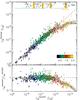
Right: comparison of with
L8 (rest-frame 8 μm broadband) for
“clean” galaxies. The observed bandpasses used to estimate
L8 are illustrated in the top of the figure and compared
to the redshifted SED of M 82. The sliding scale of the median and 68% dispersion
around it is shown with a grey zone which is fitted by the solid and dashed lines:
IR8 = 4.9 [–2.2, +2.9]. Stacked measurements combined with detections weighted by
number of objects per luminosity bin are represented by large yellow open triangles
(GOODS–south: upside down, GOODS–north: upward). The bottom panel
shows the IR8 (=/L8)
ratio which is found to remain constant with luminosity and redshift.
)
using the CE01 technique. Only “clean” galaxies are represented (as defined in
Sect. 3.1). Galaxies with spectroscopic and
photometric redshifts (from both GOODS–north and south) are marked with filled and
open symbols respectively. Colors range from black (z ~ 0)
to orange (z ~ 2.5), passing through green
(z ~ 1) and red (z ~ 2). The
wavelength range sampled by the MIPS-24 μm passband is shown in
orange at the top of the figure where it is compared to the redshifted SED of M 82.
The dashed line in the left-hand side panels is the one-to-one correlation. The
sliding median and 16th and 84th percentiles of the distribution are shown with white
dots connected with a solid line and grey zone respectively. The bottom panel
shows the ratio of the actual over extrapolated total IR luminosity.
Right: comparison of with
L8 (rest-frame 8 μm broadband) for
“clean” galaxies. The observed bandpasses used to estimate
L8 are illustrated in the top of the figure and compared
to the redshifted SED of M 82. The sliding scale of the median and 68% dispersion
around it is shown with a grey zone which is fitted by the solid and dashed lines:
IR8 = 4.9 [–2.2, +2.9]. Stacked measurements combined with detections weighted by
number of objects per luminosity bin are represented by large yellow open triangles
(GOODS–south: upside down, GOODS–north: upward). The bottom panel
shows the IR8 (=/L8)
ratio which is found to remain constant with luminosity and redshift.
Current usage metrics show cumulative count of Article Views (full-text article views including HTML views, PDF and ePub downloads, according to the available data) and Abstracts Views on Vision4Press platform.
Data correspond to usage on the plateform after 2015. The current usage metrics is available 48-96 hours after online publication and is updated daily on week days.
Initial download of the metrics may take a while.