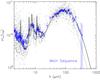
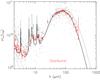
Fig. 21

Composite spectral energy distribution of the typical main sequence galaxy
(left; IR8 = 4 ± 2, see Eq. (5)) and starburst (right; IR8 > 8,
i.e., above 2σ). Light grey dots: individual GOODS–Herschel
galaxies normalized to  . The large
filled symbols with error bars are the median and associated uncertainty of the MS
(left figure, blue dots) and SB (right figure,
red dots) galaxies computed in intervals of wavelengths defined to contain a fixed
number of 25 ± 5 galaxies. The uncertainty on the median values is derived from
the 16th and 84th percentiles around the median divided by the square root of the
number of galaxies. The model fit to each SED is shown with a solid black line while
the opposing SED (MS or SB) is shown with a dotted black line for comparison.
. The large
filled symbols with error bars are the median and associated uncertainty of the MS
(left figure, blue dots) and SB (right figure,
red dots) galaxies computed in intervals of wavelengths defined to contain a fixed
number of 25 ± 5 galaxies. The uncertainty on the median values is derived from
the 16th and 84th percentiles around the median divided by the square root of the
number of galaxies. The model fit to each SED is shown with a solid black line while
the opposing SED (MS or SB) is shown with a dotted black line for comparison.
Current usage metrics show cumulative count of Article Views (full-text article views including HTML views, PDF and ePub downloads, according to the available data) and Abstracts Views on Vision4Press platform.
Data correspond to usage on the plateform after 2015. The current usage metrics is available 48-96 hours after online publication and is updated daily on week days.
Initial download of the metrics may take a while.