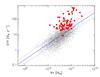
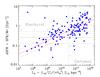
Fig. 16

Left: SFR – M ∗ correlation at z ~ 0. Galaxies classified as compact are marked with large filled red dots. Solid line: fit to the main sequence SFR–M ∗ relation: SFR ∝ M ⋆ /[4 × 109 M⊙] . Dotted lines: 16th and 84th percentiles of the distribution around the sliding median (0.26 dex). Right: relation of the sSFR and IR surface brightness of galaxies for which a radio size was estimated. The vertical dashed line illustrates the threshold above which galaxies have been classified as compact. The solid and dashed red lines are a fit to the sliding median of the relation (Eq. (11)) and its 68% dispersion.
Current usage metrics show cumulative count of Article Views (full-text article views including HTML views, PDF and ePub downloads, according to the available data) and Abstracts Views on Vision4Press platform.
Data correspond to usage on the plateform after 2015. The current usage metrics is available 48-96 hours after online publication and is updated daily on week days.
Initial download of the metrics may take a while.