Fig. 4
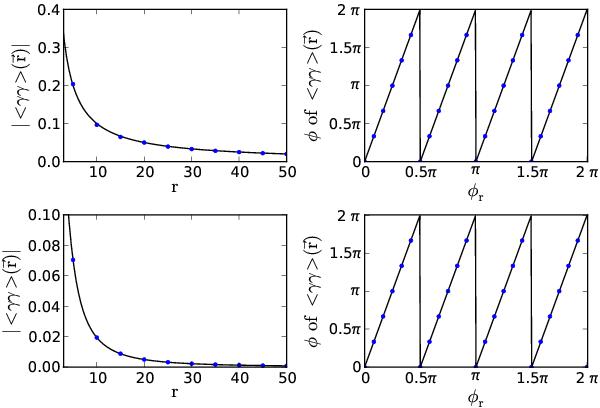
Left panels: ⟨ γγ ⟩ (r) with fixed φr = π/6 as a function of r. Right panels: polar angle of ⟨ γγ ⟩ (r) with fixed r = 20 as a function of φr. The black curves are the expected values while the dots are the results from numerical evaluation of 2D integral in (23). The ⟨ κκ ⟩ used in the upper panels is ⟨ κκ ⟩ (r) = 1/r and in the lower panels ⟨ κκ ⟩ (r) = exp(−r2).
Current usage metrics show cumulative count of Article Views (full-text article views including HTML views, PDF and ePub downloads, according to the available data) and Abstracts Views on Vision4Press platform.
Data correspond to usage on the plateform after 2015. The current usage metrics is available 48-96 hours after online publication and is updated daily on week days.
Initial download of the metrics may take a while.