Free Access
Fig. 9
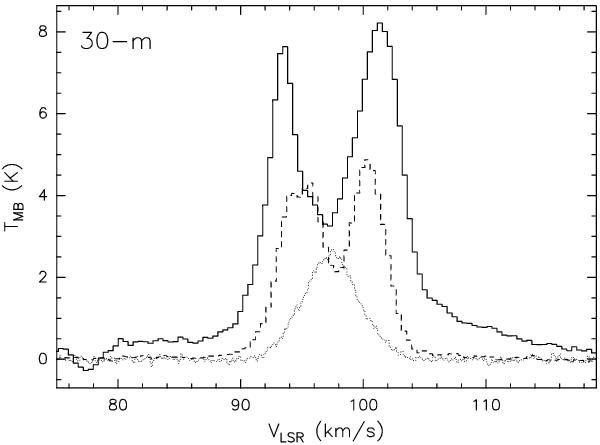
Spectra of the 12CO( (solid histogram), 13CO (dashed), and C17O (dotted; Cesaroni, unpublished data) (2–1) lines obtained by averaging the emission over a square region 30″ in size, centered on the HMC. The data have been taken with the IRAM 30-m telescope.
Current usage metrics show cumulative count of Article Views (full-text article views including HTML views, PDF and ePub downloads, according to the available data) and Abstracts Views on Vision4Press platform.
Data correspond to usage on the plateform after 2015. The current usage metrics is available 48-96 hours after online publication and is updated daily on week days.
Initial download of the metrics may take a while.