Fig. 7
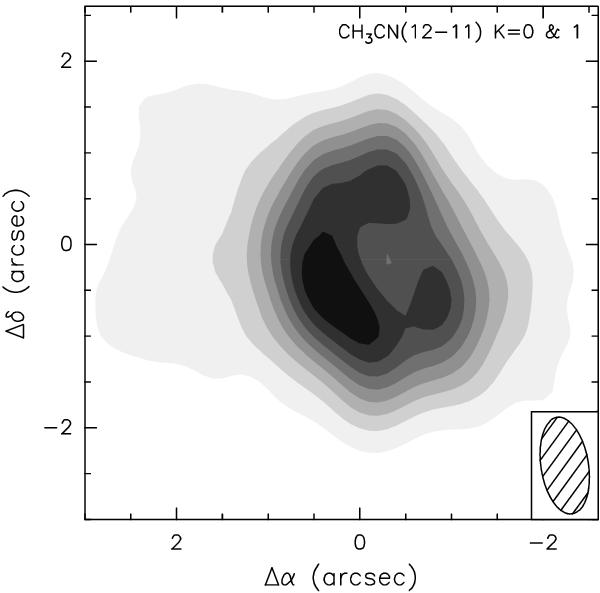
Map of the CH3CN(12–11) emission obtained by averaging the emission
under the K = 0 and 1 components. The image has been reconstructed
with a clean beam (ellipse in the bottom right) equal to that of the images of
BEL04, i.e. 1 1 × 05
with PA = 189°. The contour levels range from 75 to 600 in steps of 75 mJy/beam.
Offsets are measured with respect to the phase center.
1 × 05
with PA = 189°. The contour levels range from 75 to 600 in steps of 75 mJy/beam.
Offsets are measured with respect to the phase center.
Current usage metrics show cumulative count of Article Views (full-text article views including HTML views, PDF and ePub downloads, according to the available data) and Abstracts Views on Vision4Press platform.
Data correspond to usage on the plateform after 2015. The current usage metrics is available 48-96 hours after online publication and is updated daily on week days.
Initial download of the metrics may take a while.