Fig. 6
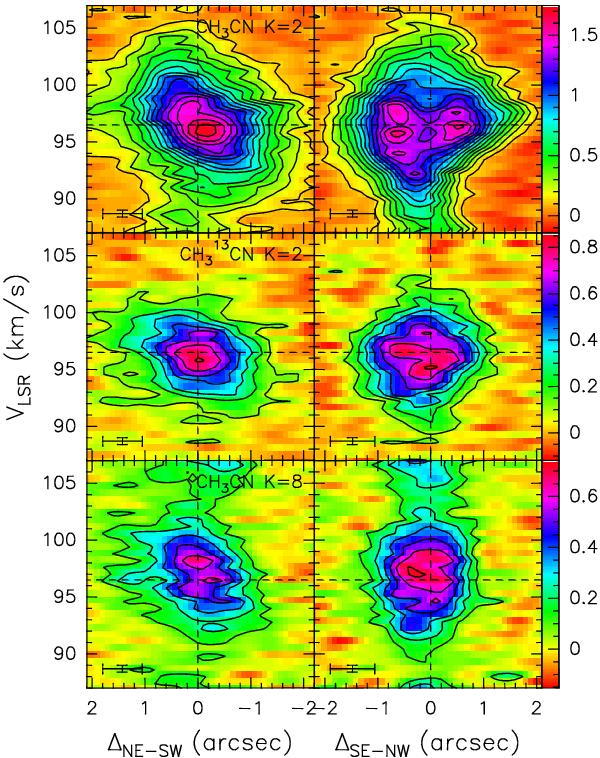
Position-velocity plots of along PA = 68° (left panels) and –22° (right panels) for three different lines (indicated in each panel). Offsets are measured with respect to the phase center. Contour levels start from 0.12 Jy/beam and increase in steps of 0.12 Jy/beam. The cross in the bottom left of each box denotes the angular and spectral resolutions.
Current usage metrics show cumulative count of Article Views (full-text article views including HTML views, PDF and ePub downloads, according to the available data) and Abstracts Views on Vision4Press platform.
Data correspond to usage on the plateform after 2015. The current usage metrics is available 48-96 hours after online publication and is updated daily on week days.
Initial download of the metrics may take a while.