Fig. 5
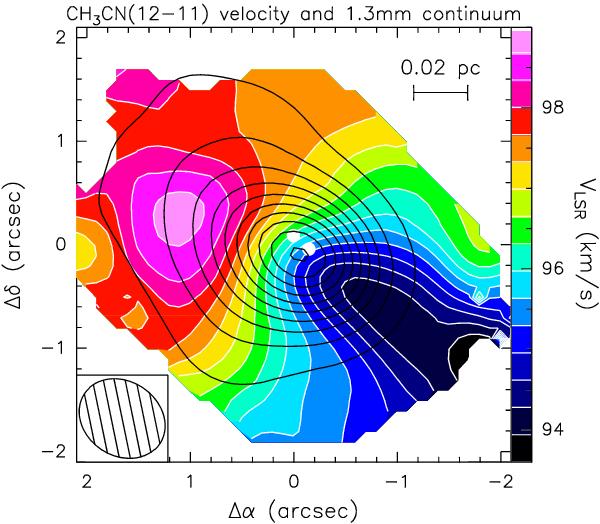
Overlay of the map of the 1.3 mm continuum emission (contours) on that of the CH3CN(12–11) line velocity (color scale). Contour levels range from 0.1 to 2 in steps of 0.2 Jy/beam. Offsets are measured with respect to the phase center. The two white dots denote the free-free continuum sources detected by Cesaroni et al. (2010). The synthesized beam is shown in the bottom left.
Current usage metrics show cumulative count of Article Views (full-text article views including HTML views, PDF and ePub downloads, according to the available data) and Abstracts Views on Vision4Press platform.
Data correspond to usage on the plateform after 2015. The current usage metrics is available 48-96 hours after online publication and is updated daily on week days.
Initial download of the metrics may take a while.