Fig. 4
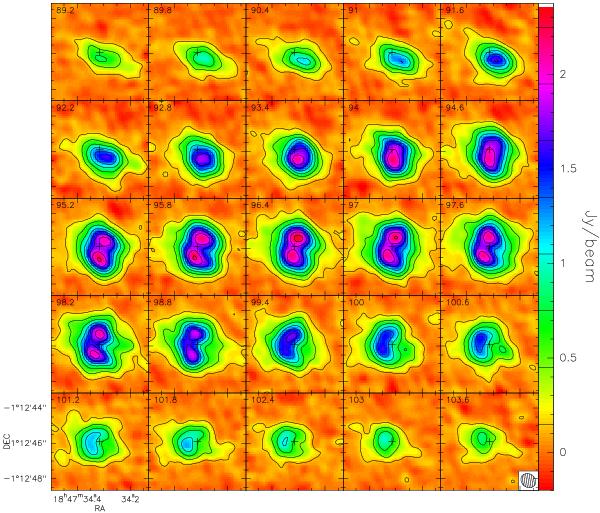
Channel maps of the CH3CN(12–11) emission obtained by averaging the K = 2, 3, and 4 components. The number in the top left of each panel gives the corresponding LSR velocity. The values of the contour levels are indicated by the tick marks in the intensity scale to the right. The cross denotes the phase center. The ellipse in the bottom right of the last panel is the full-width-at-half power of the synthesized beam.
Current usage metrics show cumulative count of Article Views (full-text article views including HTML views, PDF and ePub downloads, according to the available data) and Abstracts Views on Vision4Press platform.
Data correspond to usage on the plateform after 2015. The current usage metrics is available 48-96 hours after online publication and is updated daily on week days.
Initial download of the metrics may take a while.