Fig. 3
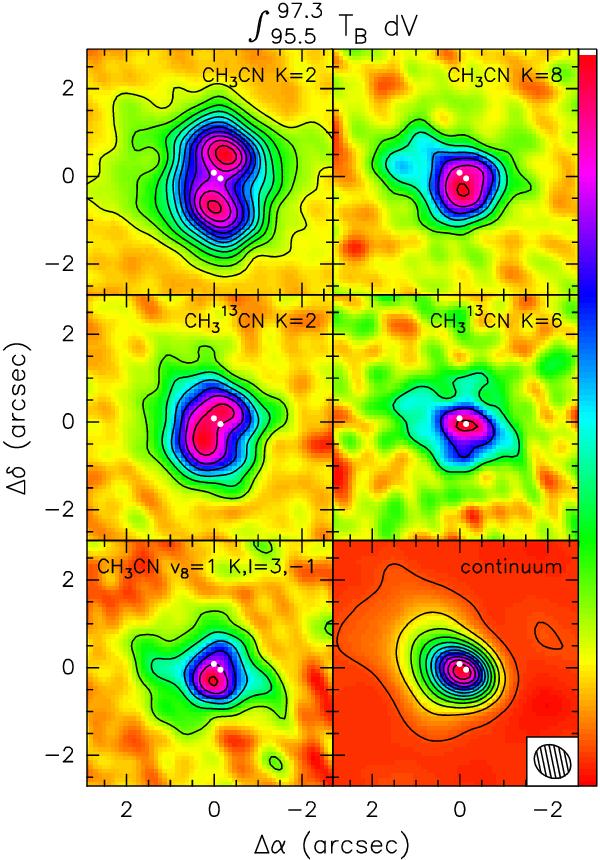
Same as Fig. 2, with the line maps obtained by averaging the emission from 95.5 km s-1 to 97.3 km s-1 (see Fig. 1, bottom). Contour levels start from 0.15 Jy/beam and increase in steps of 0.2 Jy/beam for all line maps, and range from 0.035 Jy/beam to 1.785 Jy/beam in steps of 0.175 Jy/beam for the continuum map.
Current usage metrics show cumulative count of Article Views (full-text article views including HTML views, PDF and ePub downloads, according to the available data) and Abstracts Views on Vision4Press platform.
Data correspond to usage on the plateform after 2015. The current usage metrics is available 48-96 hours after online publication and is updated daily on week days.
Initial download of the metrics may take a while.