Fig. 2
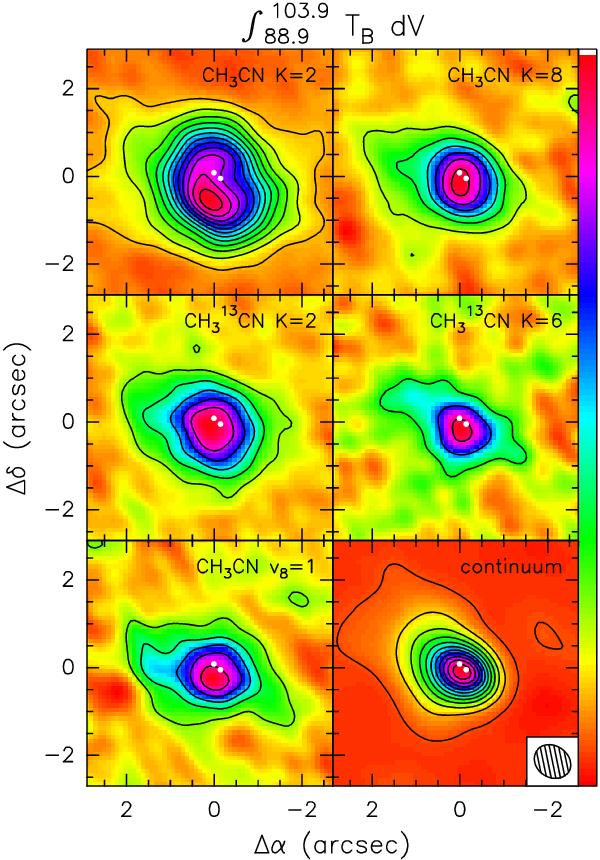
Maps of the line and continuum emission toward the G31.41 HMC. The line maps have
been obtained by averaging the emission under the whole line profile, namely from
88.9 km s-1 to 103.9 km s-1 (see Fig. 1, bottom). The tracer used is indicated in the
top right of each panel. The two white points mark the positions of the
free-free-continuum sources detected by Cesaroni et al. (2010). The contour levels start from 0.072 Jy/beam and increase
in steps of 0.12 Jy/beam for all line maps, and range from 0.035 Jy/beam to
1.785 Jy/beam in steps of 0.175 Jy/beam for the continuum map. Offsets are measured
with respect to the phase center
α(J2000) = 18h47m34 315
δ(J2000) = –01°12′45
315
δ(J2000) = –01°12′45 9.
The ellipse in the bottom right denotes the FWHP of the synthesized beam.
9.
The ellipse in the bottom right denotes the FWHP of the synthesized beam.
Current usage metrics show cumulative count of Article Views (full-text article views including HTML views, PDF and ePub downloads, according to the available data) and Abstracts Views on Vision4Press platform.
Data correspond to usage on the plateform after 2015. The current usage metrics is available 48-96 hours after online publication and is updated daily on week days.
Initial download of the metrics may take a while.