Fig. 14
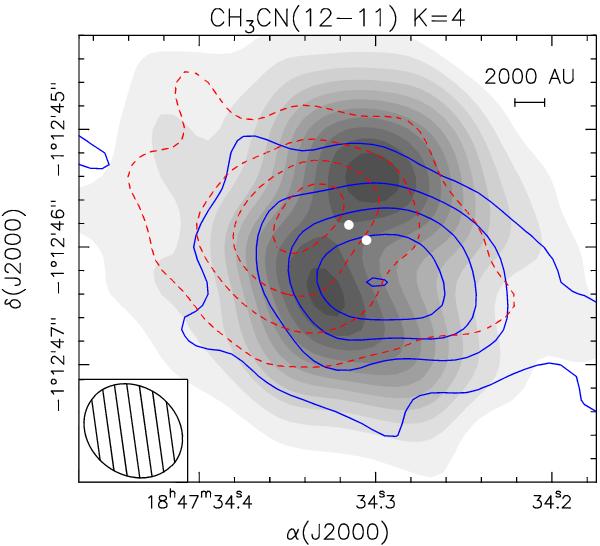
Maps of the blue- (solid contours) and red-shifted (dashed) emission in the CH3CN(12–11) K = 4 line overlayed on the bulk emission (gray scale) in the same line. The integration was performed over the velocity ranges 88.9–91.3 km s-1, 100.9–103.3 km s-1, and 95.2–96.7 km s-1, respectively. Contour levels increase from 0.15 in steps of 0.27 Jy/beam for the blue- and red-shifted gas, and from 0.2 in steps of 0.2 Jy/beam for the bulk emission. The synthesized beam of the images is drawn in the bottom left. The two white points mark the positions of the two compact free-free sources detected by Cesaroni et al. (2010).
Current usage metrics show cumulative count of Article Views (full-text article views including HTML views, PDF and ePub downloads, according to the available data) and Abstracts Views on Vision4Press platform.
Data correspond to usage on the plateform after 2015. The current usage metrics is available 48-96 hours after online publication and is updated daily on week days.
Initial download of the metrics may take a while.