Fig. 13
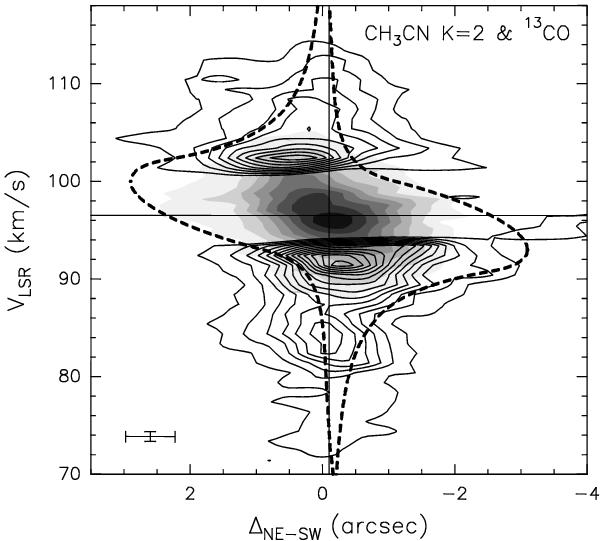
Overlay of the 13CO(2–1) (only SMA data; contours) and CH3CN(12–11) K = 4 position-velocity plots along the direction with PA = 68° passing through the HMC. The offset is measured from the phase center, positive toward NE. Contour levels increase from 0.2 in steps of 0.2 Jy/beam for CH3CN and from 0.1 in steps of 0.1 Jy/beam for 12CO. The vertical and horizontal solid lines denote the position of the continuum peak and the systemic velocity, respectively. The thick dashed pattern encompasses the region inside which emission is expected from a disk with radius of 3″ (or 0.11 pc) undergoing free-fall and Keplerian rotation about 330 M⊙. The cross in the bottom left denotes the angular and spectral resolutions.
Current usage metrics show cumulative count of Article Views (full-text article views including HTML views, PDF and ePub downloads, according to the available data) and Abstracts Views on Vision4Press platform.
Data correspond to usage on the plateform after 2015. The current usage metrics is available 48-96 hours after online publication and is updated daily on week days.
Initial download of the metrics may take a while.