Fig. 12
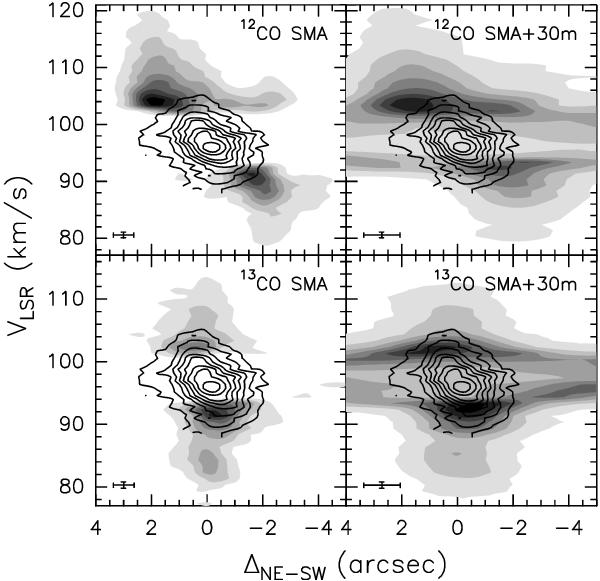
Position-velocity plots along the direction with PA = 68° passing through the HMC. The offset is measured from the phase center, positive toward NE. Contours correspond the CH3CN(12–11) K = 4 component emission, while gray scales indicate the 12CO(2–1) and 13CO(2–1) line emission, as indicated in each box. Contour levels increase from 0.2 in steps of 0.2 Jy/beam for CH3CN, from 0.24 in steps of 0.24 Jy/beam for 12CO SMA, from 0.6 in steps of 1 Jy/beam for 12CO SMA+30 m, from 0.12 in steps of 0.175 Jy/beam for 13CO SMA, and from 0.15 in steps of 0.5 Jy/beam for 13CO SMA+30 m. The cross in the bottom left of each box denotes the angular and spectral resolutions.
Current usage metrics show cumulative count of Article Views (full-text article views including HTML views, PDF and ePub downloads, according to the available data) and Abstracts Views on Vision4Press platform.
Data correspond to usage on the plateform after 2015. The current usage metrics is available 48-96 hours after online publication and is updated daily on week days.
Initial download of the metrics may take a while.