Fig. 10
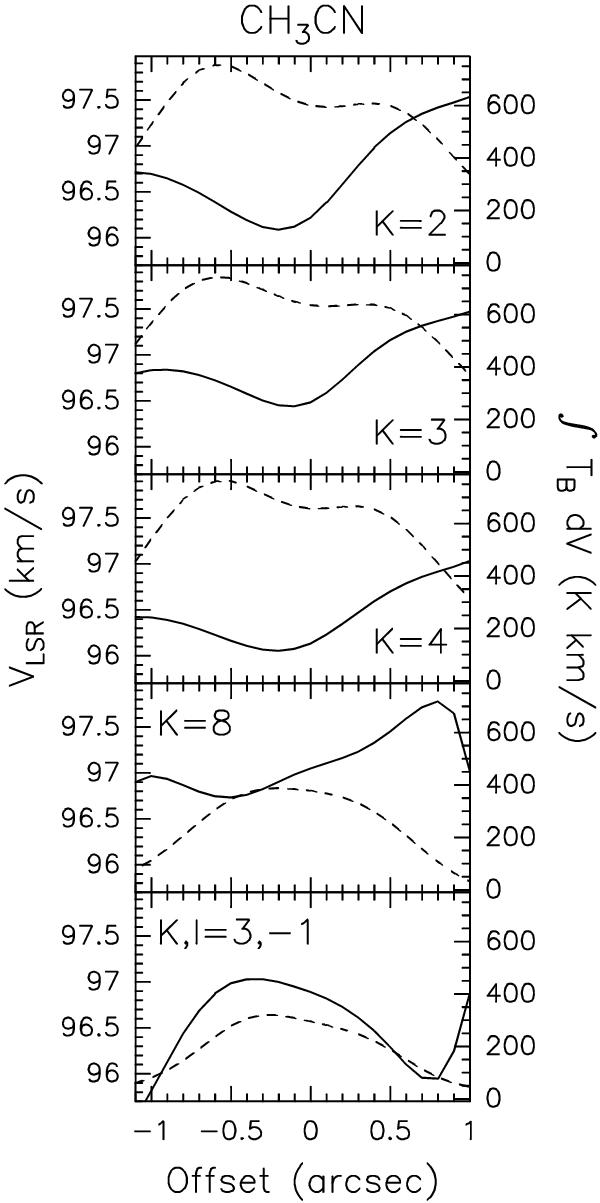
Solid curves represent the first moments of several CH3CN(12–11)
components (indicated in the top left of each panel) estimated along a cut through
the continuum peak
(α(J2000) = 18h47m34 31
δ(J2000) = –01°12′46
31
δ(J2000) = –01°12′46 0)
with PA = –22°, i.e. perpendicular to the velocity gradient in Fig. 5. The dashed curves are the zero moments of the
corresponding lines.
0)
with PA = –22°, i.e. perpendicular to the velocity gradient in Fig. 5. The dashed curves are the zero moments of the
corresponding lines.
Current usage metrics show cumulative count of Article Views (full-text article views including HTML views, PDF and ePub downloads, according to the available data) and Abstracts Views on Vision4Press platform.
Data correspond to usage on the plateform after 2015. The current usage metrics is available 48-96 hours after online publication and is updated daily on week days.
Initial download of the metrics may take a while.