Fig. 1
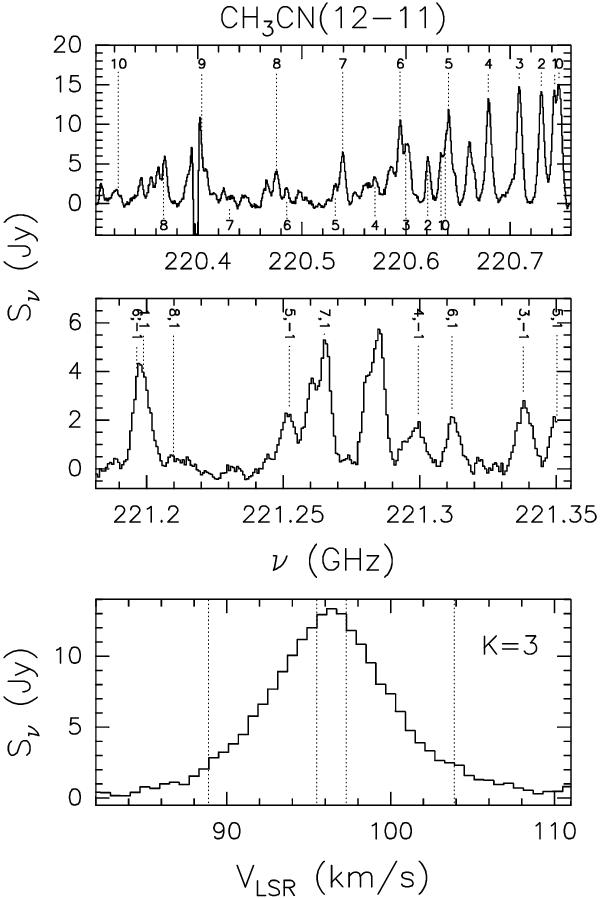
Spectra obtained by integrating the line emission over the whole core. Top: ground-state K-components of the J = 12 → 11 transition of CH3CN (numbers above the spectrum) and of the CH313CN isotopomer (numbers below the spectrum). Note how most K-lines are blended with each other and/or with lines of other molecules. Middle: vibrationally excited (v8 = 1) lines of CH3CN. The K, l quantum numbers of the transitions are indicated above the spectrum. Bottom: ground state K = 3 component. The dotted lines mark the velocity ranges used to produce the maps in Figs. 2 and 3.
Current usage metrics show cumulative count of Article Views (full-text article views including HTML views, PDF and ePub downloads, according to the available data) and Abstracts Views on Vision4Press platform.
Data correspond to usage on the plateform after 2015. The current usage metrics is available 48-96 hours after online publication and is updated daily on week days.
Initial download of the metrics may take a while.