Fig. 9
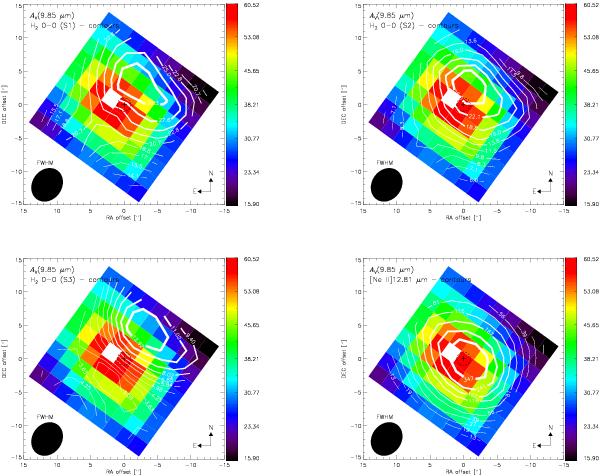
IRS/SL map of the silicate-based extinction AV(9.85 μm) with the contour lines of the IRS/SH map of the surface brightness (in units of 10-12 W cm-2 sr-1) of the molecular hydrogen line H2 S(1) 17.0 μm (top left panel), the IRS/SH map of the H2 S(2) 12.3 μm line (top right panel), the IRS/SL map of the H2 S(3) 9.7 μm line (bottom left panel), and the IRS/SH map of the [Ne II] 12.81 μm (bottom right panel). The figures show that the H2 emission is stronger in a region ≳2.3′′ away from the peak obscuration, although the H2 S(2) is the closest to the peak obscuration and to the H2O mega maser, as well as the [Ne II], which peaks at the H2O mega maser (within ~1′′), as seen in Fig. 5.
Current usage metrics show cumulative count of Article Views (full-text article views including HTML views, PDF and ePub downloads, according to the available data) and Abstracts Views on Vision4Press platform.
Data correspond to usage on the plateform after 2015. The current usage metrics is available 48-96 hours after online publication and is updated daily on week days.
Initial download of the metrics may take a while.