Fig. 7
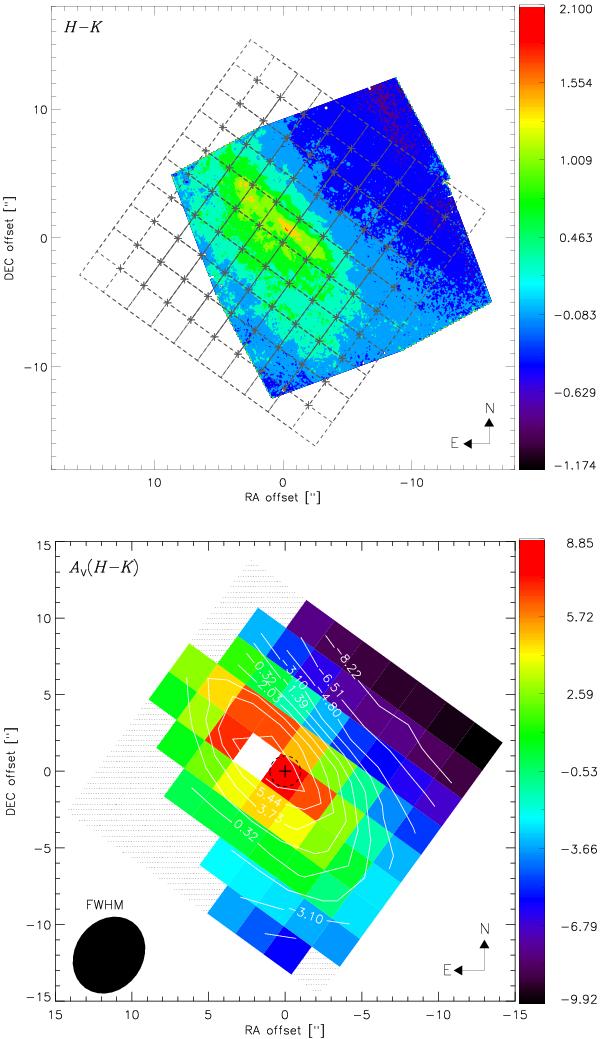
Top panel – HST-NICMOS H − K color image (mag) reported by Marconi et al. (2000). The Spitzer-IRS SH grid is overlaid to show the difference in resolution and the different orientations of the fields of view. Bottom panel – Foreground screen extinction AV(H − K) estimated from the H − K color image at the resolution of the IRS/SH map. The SH pixels that cover less than 400 pixels in the H − K image are shown in dashed lines.
Current usage metrics show cumulative count of Article Views (full-text article views including HTML views, PDF and ePub downloads, according to the available data) and Abstracts Views on Vision4Press platform.
Data correspond to usage on the plateform after 2015. The current usage metrics is available 48-96 hours after online publication and is updated daily on week days.
Initial download of the metrics may take a while.