Fig. 6
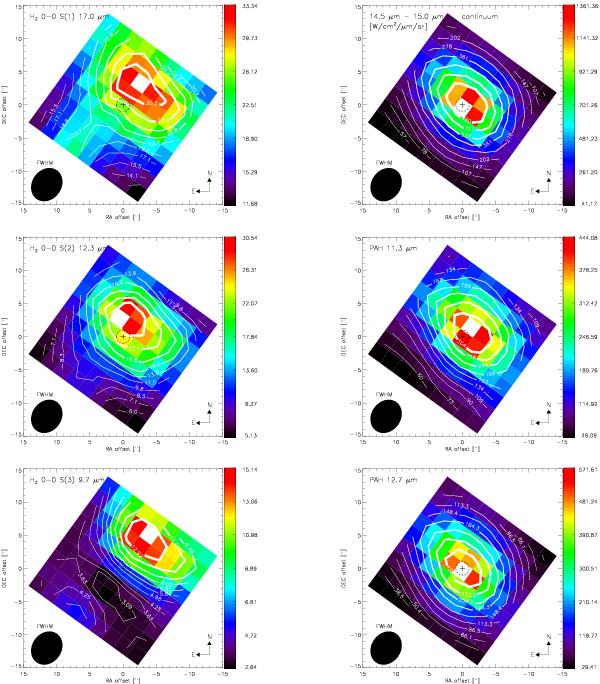
IRS/SH surface brightness (10-12 W cm-2 sr-1) maps of the molecular hydrogen lines (left panels, from top to bottom) H2 S(1) at 17.0 μm and H2 S(2) at 12.3 μm, and the H2 S(3) line at 9.7 μm from the IRS/SL map. The right panel shows (from top to bottom) the average continuum flux density (10-12 W cm-2 μm-1 sr-1) between 14.5 μm and 15.0 μm, and the surface brightness (10-12 W cm-2 sr-1) of the PAH features at 11.3 μm and 12.7 μm. The details in the maps are the same as in Fig. 5.
Current usage metrics show cumulative count of Article Views (full-text article views including HTML views, PDF and ePub downloads, according to the available data) and Abstracts Views on Vision4Press platform.
Data correspond to usage on the plateform after 2015. The current usage metrics is available 48-96 hours after online publication and is updated daily on week days.
Initial download of the metrics may take a while.