Fig. 5
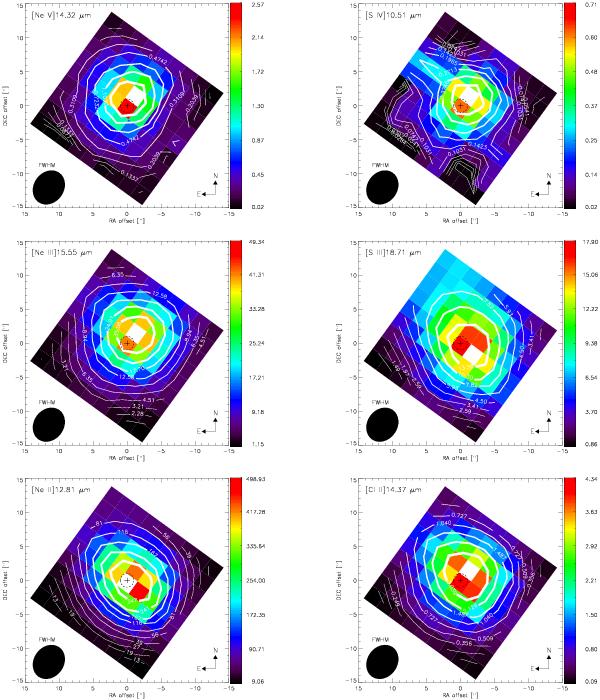
IRS/SH surface brightness (10-12 W cm-2 sr-1) maps of the fine-structure lines (left panels, from top to bottom) [Ne V] 14.32 μm, [Ne III] 15.55 μm, [Ne II] 12.81 μm, (right panels, from top to bottom) [S IV] 10.51 μm, [S III] 18.71 μm, and [Cl II] 14.37 μm. The peak fluxes are shown with a white pixel. These fluxes are not corrected for extinction, and each of the 9 × 9 pixels correspond to the fitted flux in the 2 × 2 aperture extracted spectrum as described in Sects. 2.3 and 3.2. The dashed-line circle represents the ± 1′′ pointing accuracy of Spitzer, and the contour lines are labeled. The reference (Δα = 0,Δδ = 0) is marked with a cross and corresponds to the position RA (J2000) = 13:05:27.477, Dec (J2000) = –49:28:05.57 of the H2O mega maser reported by Greenhill et al. (1997).
Current usage metrics show cumulative count of Article Views (full-text article views including HTML views, PDF and ePub downloads, according to the available data) and Abstracts Views on Vision4Press platform.
Data correspond to usage on the plateform after 2015. The current usage metrics is available 48-96 hours after online publication and is updated daily on week days.
Initial download of the metrics may take a while.