Fig. 4
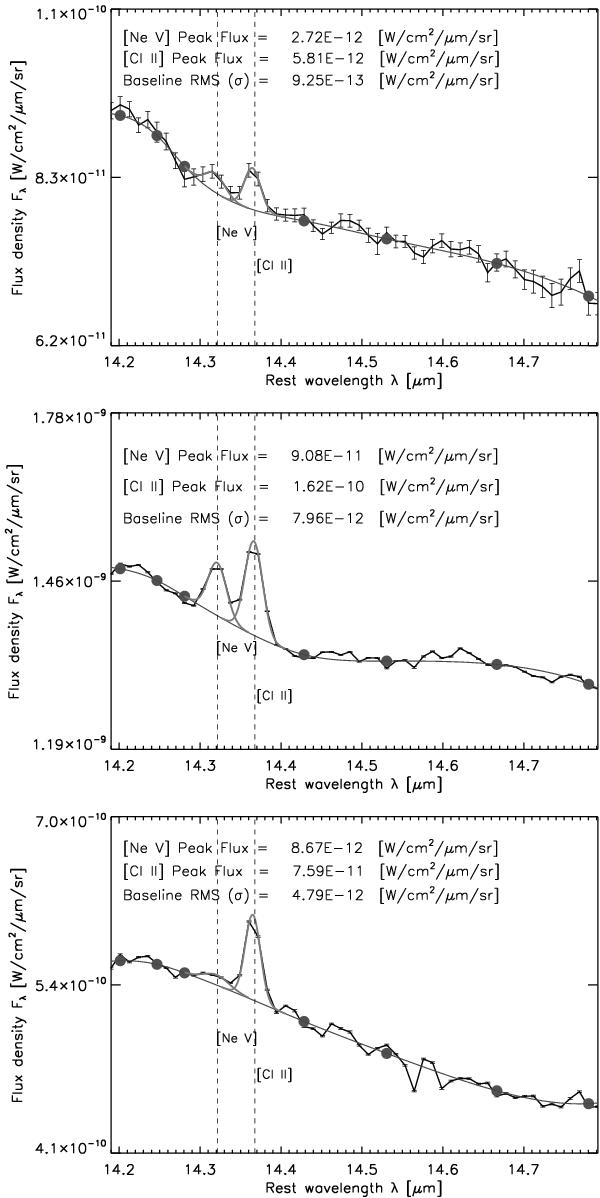
Gaussian fit of the [Ne V] 14.32 μm and [Cl II] 14.37 μm fine-structure emission lines at three different pixels of the IRS/SH map. The error bars indicate the uncertainties of the spectral data. The filled circles indicates the pivots used for the cubic spline interpolation of the baseline. The top panel shows less than 3σ detection for [Ne V] but a clear detection of the [Cl II] line. The spectrum of the middle panel shows clear detections of both lines. The bottom panel shows <3σ detection for [Ne V], in spite of the low uncertainties in the data points.
Current usage metrics show cumulative count of Article Views (full-text article views including HTML views, PDF and ePub downloads, according to the available data) and Abstracts Views on Vision4Press platform.
Data correspond to usage on the plateform after 2015. The current usage metrics is available 48-96 hours after online publication and is updated daily on week days.
Initial download of the metrics may take a while.