Fig. 3
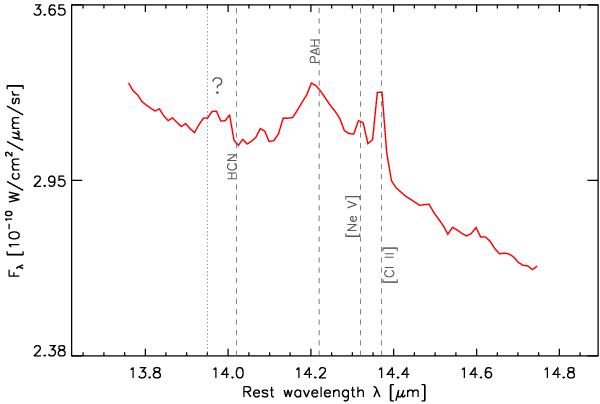
Zoom into the [Ne V] complex wavelength range from the average IRS/SH spectrum of Fig. 2. At these wavelengths we find the first bending mode of HCN at 14.02 μm, and the AGN tracer [Ne V] at 14.22 μm, almost blended with the fine-structure emission line [Cl II] at 14.37 μm, on the slope of the PAH feature around 14.22 μm. The dotted line shows the wavelength at which we found an order mismatch, probably producing the unknown feature observed next to the HCN 14.02 μm, which could be affected.
Current usage metrics show cumulative count of Article Views (full-text article views including HTML views, PDF and ePub downloads, according to the available data) and Abstracts Views on Vision4Press platform.
Data correspond to usage on the plateform after 2015. The current usage metrics is available 48-96 hours after online publication and is updated daily on week days.
Initial download of the metrics may take a while.