Fig. 2
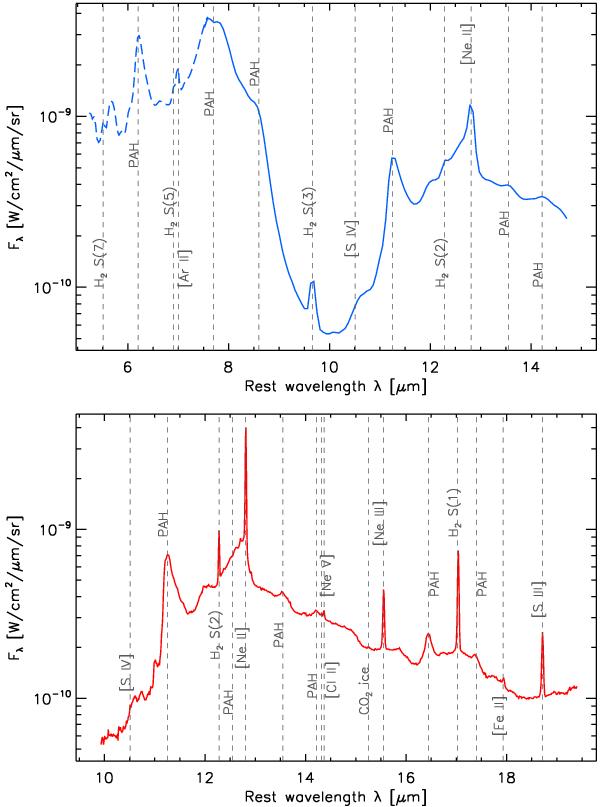
Top panel – Average spectrum of the equivalent field of view of the SH map of the nuclear region of NGC 4945, as seen in the SL map. The SL2 order is shown with a dashed line. The most significant fine structure emission lines and PAH features in the SL wave range are labeled, in particular the ones that overlap with the SH waverange. Bottom panel – Average spectrum of the whole field of view of the SH map. The higher spectral resolution of the IRS/SH module allows emission lines to be distinguished such as [Ne V]14.32 μm and [Cl II]14.37 μm, otherwise blended in the IRS/SL module. These spectra are not corrected for extinction.
Current usage metrics show cumulative count of Article Views (full-text article views including HTML views, PDF and ePub downloads, according to the available data) and Abstracts Views on Vision4Press platform.
Data correspond to usage on the plateform after 2015. The current usage metrics is available 48-96 hours after online publication and is updated daily on week days.
Initial download of the metrics may take a while.