Fig. 16
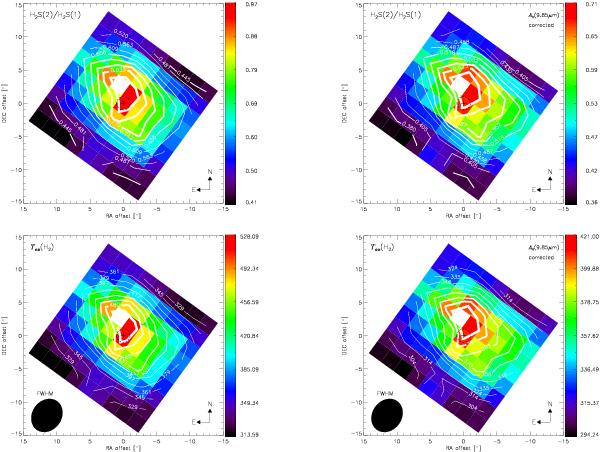
Left panels – IRS/SH maps of the H2 0−0 S(2) to H2 0−0 S(1) total flux ratio (top left panel), and the map of the estimated Tex (K) of the molecular hydrogen. The peak excitation temperature of ~528 K is reached about ≳2.3′′ (one pixel) to the north of the H2O mega maser. Right panels – Same as above, but using the extinction corrected fluxes of the H2 S(2) and S(1) lines. The extinction correction leads to an ~100 K lower peak temperature.
Current usage metrics show cumulative count of Article Views (full-text article views including HTML views, PDF and ePub downloads, according to the available data) and Abstracts Views on Vision4Press platform.
Data correspond to usage on the plateform after 2015. The current usage metrics is available 48-96 hours after online publication and is updated daily on week days.
Initial download of the metrics may take a while.